XR Adaptive Modality: Case Study
XR/HCI
Gaze Interaction
Bayesian LBA
Remote Study
arXiv
I built a remote XR interaction testbed and evaluated whether a context-aware adaptive system can reduce gaze failure modes (e.g., Midas Touch slips: accidental activations) and workload under time pressure.
RoleSole Researcher — Study Design, Development, Analysis
MethodsISO 9241-9, Fitts' Law, NASA-TLX, Bayesian LBA (PyMC), Williams Counterbalancing
StackReact, TypeScript, Python, PyMC, Quarto
OutputarXiv preprint · Remote testbed (live) · Case study
TL;DR
I built a remote XR interaction testbed and evaluated whether a context-aware adaptive system can reduce gaze failure modes (e.g., Midas Touch slips: accidental activations) and workload under time pressure.
Design
2×2×2 within-subjects
Participants
N=81 hand / N=81 gaze
Core metrics
TP (throughput) · Error · MT (movement time) · TLX (workload)
xr-adaptive-modality-2025
React/TypeScript XR pointing testbed + policy-driven adaptation + analysis pipeline.
What I Built
What I shipped
I built a remote XR interaction research platform—from task UI to analysis—so I could quantify speed–accuracy tradeoffs, surface XR-specific failure modes (e.g., Midas Touch slips), and evaluate adaptive UI policies with full replayable telemetry.
Study application
React + TypeScript experiment UI
Responsive Fitts' Law task + HUD, two modalities, pressure manipulation, and block-level workload collection.
Gaze simulation
Psychophysics-inspired gaze proxy
Fixation-state Gaussian jitter, saccadic suppression, and confirmation behavior to reproduce gaze failure modes in remote testing.
Adaptive system
Policy engine + replayable diagnostics
Threshold triggers with hysteresis, policy state logging, and replay summaries to verify when adaptation did (or didn't) execute.
Analysis
Reproducible reporting pipeline
Mixed-effects models + LBA cognitive modeling + Quarto-based reproducible analysis. All figures and tables regenerate from raw logs with consistent QC and model specifications.
Implementation notes (optional) — for engineers
Development approach: Despite not being a software/web developer by training, I delivered this full-stack research platform efficiently using Cursor AI for code generation and iteration, enabling rapid prototyping and deployment. The entire system—from React UI to analysis pipeline—was built and deployed to Vercel in a matter of weeks, demonstrating that modern AI-assisted development tools can bridge domain expertise gaps.
Tech stack:
- Frontend: React 18 + TypeScript, Vite build tool, React Router for multi-page flow
- Deployment: Vercel (automatic CI/CD from GitHub, zero-config deployment)
- Analysis: R (tidyverse, lme4, emmeans) + Quarto for reproducible reporting
- Data export: CSV download + optional EmailJS submission (compressed with pako)
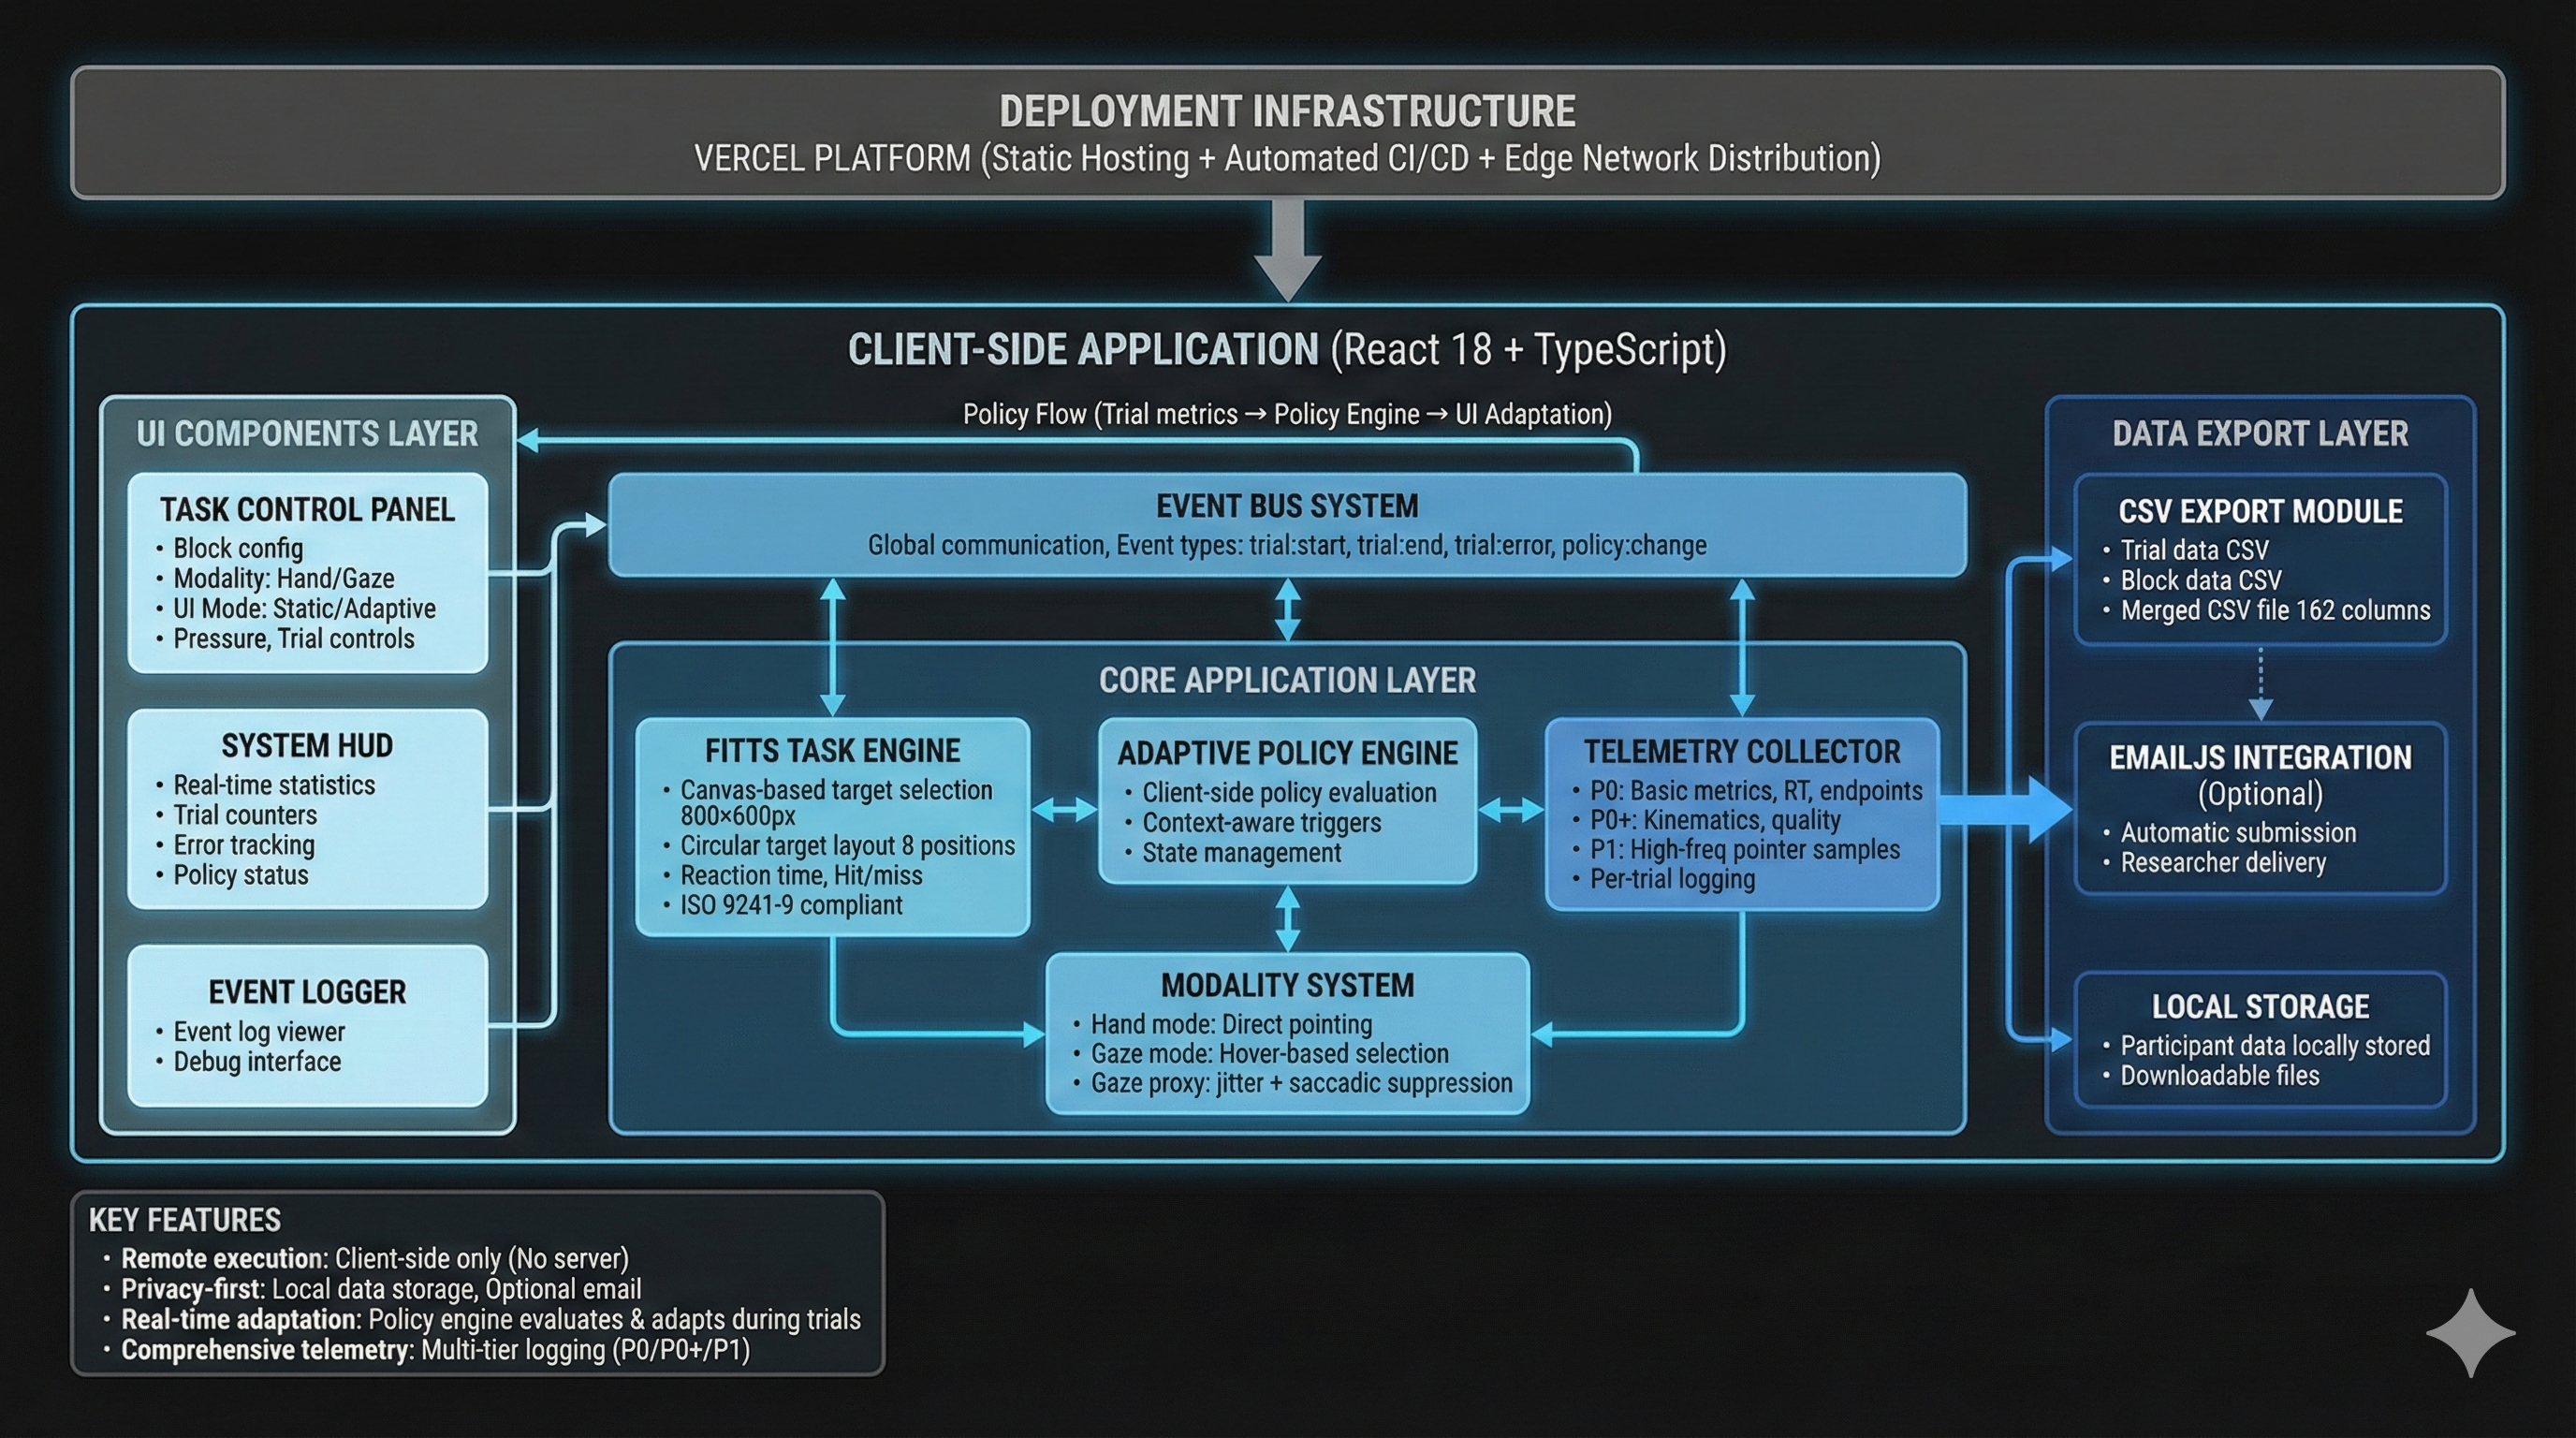
Architecture components:
- Task UI (
app/src/components/FittsTask.tsx): Canvas-based ISO 9241-9 compliant Fitts’ Law implementation with circular target layout, real-time movement tracking, and hit/miss detection - Gaze proxy (
app/src/lib/modality.ts): Psychophysics simulation with fixation-state Gaussian jitter, saccadic suppression (velocity-based freezing), and confirmation model (dwell/SPACE + tolerance ring) - Policy engine (
app/src/lib/policy.ts): Rule-based adaptation with RT percentile thresholds, error burst detection, hysteresis (N-trial smoothing), and replayable state logs for debugging - Telemetry collector (
app/src/lib/telemetry/collector.ts): Structured event logging (trial lifecycle, movement samples at 60Hz, display metadata, policy state changes) with automatic QC flagging (focus/blur, invalid RTs, display violations) - Multi-page flow: React Router with routes for consent → demographics → system check → calibration → task → debrief
System Overview:
- Stack: React 18 + TypeScript, deployed on Vercel
- Experiment Engine: Block/condition assignment using Williams counterbalancing sequences
- Deployment: Vercel with automated CI/CD
Telemetry Schema:
The telemetry system logs comprehensive per-trial data including trial metadata, performance metrics, Fitts’ parameters, endpoint data, movement samples (60Hz), display state, and policy state. Key fields include:
- Trial Metadata: trial_id, session_id, participant_id, taskType
- Performance Metrics: rt_ms, correct, movement_time_ms, submovement_count
- Fitts’ Parameters: A (amplitude), W (width), ID (index of difficulty), target_width_px
- Endpoint Data: endpoint_x/y, endpoint_error_px, target_center_x/y, path_length_px, peak_velocity_px_s, curvature_index
- Movement Samples: 60Hz sampling with sd_along_px, sd_ortho_px for path analysis
- Display State: screen_width, screen_height, device_pixel_ratio
- Policy State: adaptation_triggered (boolean), width_scale_factor (applied scaling)
Key technical decisions:
- Client-side only: All processing happens in the browser (no backend), enabling fast deployment and privacy-preserving data collection
- Event-driven architecture: Global event bus for inter-component communication (TaskPane ↔︎ HUDPane ↔︎ LoggerPane)
- Policy replay system: Every policy decision is logged with full context, enabling post-hoc analysis of “why adaptation did/didn’t trigger”
- Reproducible analysis: Quarto document (
Report.qmd) regenerates all figures/tables from raw CSV logs with consistent QC exclusions
File structure highlights:
app/src/routes/— Multi-page flow components (Intro, Demographics, SystemCheck, Calibration, Task, Debrief)app/src/components/— Reusable UI components (FittsTask, TaskPane, HUDPane, TLXForm)app/src/lib/— Core logic (policy engine, modality simulation, telemetry, CSV export)policy/— JSON policy configuration files (default vs locked variants)analysis/— R scripts for data processing, QC, and statistical modelingReport.qmd— Main Quarto analysis document (regenerates all outputs)
Performance & optimization:
- 60Hz movement sampling for smooth cursor tracking
- Compressed telemetry export (pako gzip) for EmailJS size limits
- Lazy loading and code splitting via Vite
- TypeScript strict mode for type safety and early error detection
Design & Methods
Experimental Procedure & Participant Journey
This visualization outlines the complete participant journey from onboarding through data collection, showing the factorial design structure and key methodological details:
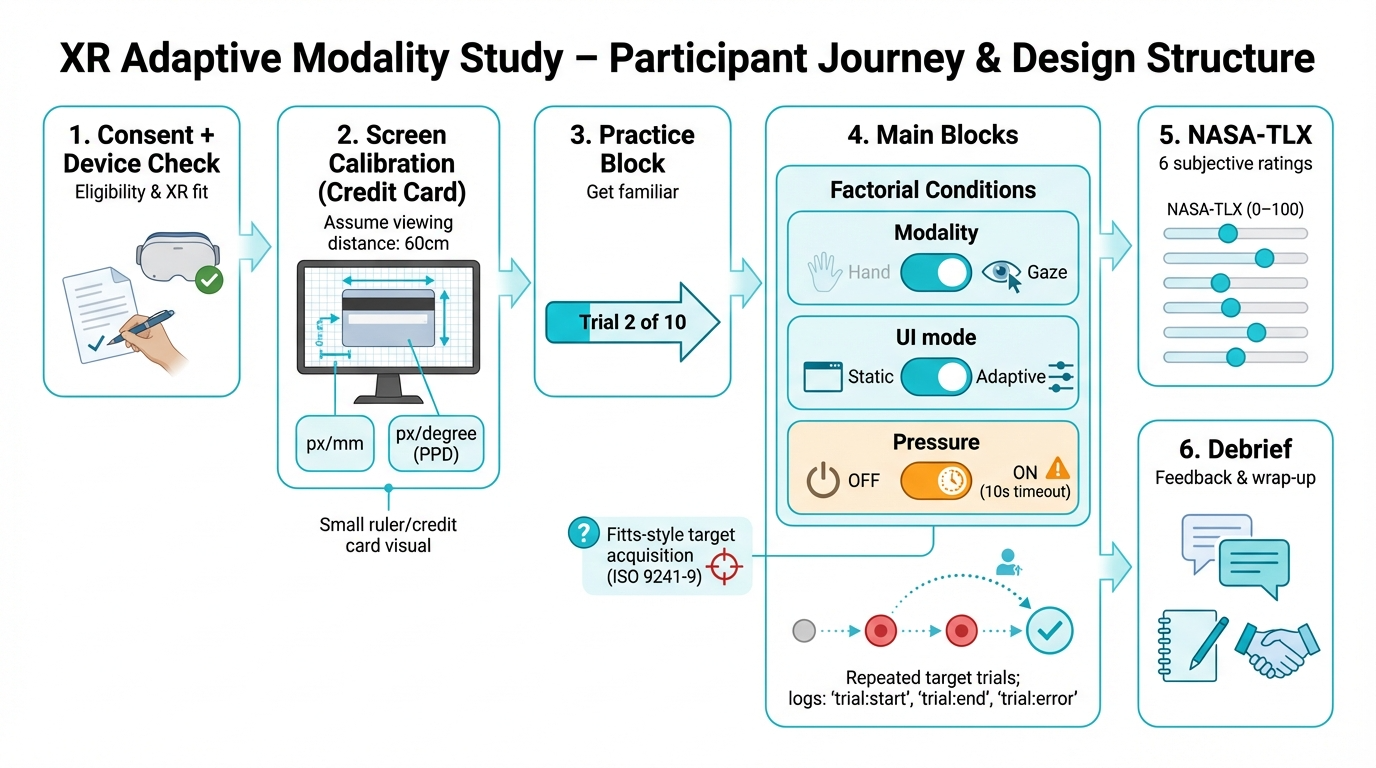
Key Design Elements Shown:
- Screen Calibration: Credit card method for calculating pixels-per-millimeter (px/mm) and pixels-per-degree (PPD) at assumed 60cm viewing distance
- Factorial Conditions: 2×2×2 within-subjects design (Modality: Hand/Gaze × UI Mode: Static/Adaptive (declutter for gaze; width inflation for hand) × Pressure: OFF/ON)
- Fitts’ Law Task: ISO 9241-9 compliant target acquisition with repeated trials
- NASA-TLX Assessment: 6-item workload questionnaire (0-100 scales) after each block
- Data Logging: Comprehensive event tracking (
trial:start,trial:end,trial:error)
Tip
Quick primer (so the results make sense)
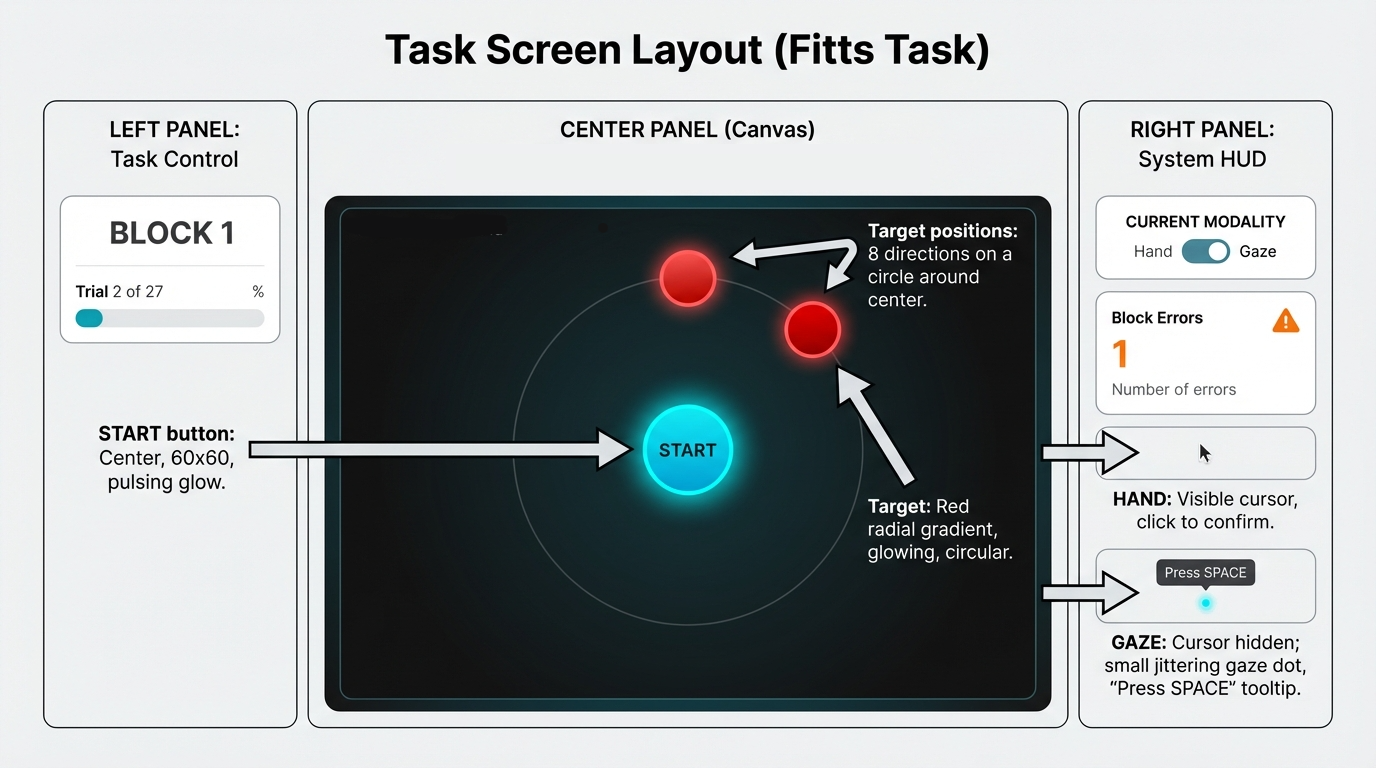
Why this task? We use a Fitts’ Law pointing task because it’s the standard HCI benchmark for target selection: it isolates the core loop (move → acquire → confirm) while systematically controlling difficulty via target distance (A) and width (W).
How to read the metrics (direction matters):
- Throughput (TP, bits/s) = speed–accuracy efficiency (higher = better). It rewards being fast without getting sloppy.
- Movement Time (MT, s) = time to complete a selection (lower = faster).
- Error rate (%) = failed selections (lower = more reliable).
- NASA-TLX (0–100) = perceived workload (lower = easier). We report the unweighted average of the 6 subscales.
XR failure-mode vocabulary:
- Slip = accidental activation (classic “Midas Touch” pattern).
- Miss/timeout = failed selection due to precision or timing constraints.
Why Fitts’ Law + Throughput? We use a Fitts’ Law pointing task (ISO 9241-9 compliant) because it isolates the core interaction loop (“move → acquire → confirm”) while systematically controlling difficulty. Rather than looking at speed and errors separately, we report Throughput (TP) as the primary performance metric—it combines movement time and effective accuracy into a single efficiency score (higher = better). This helps avoid misleading conclusions like “faster, but much sloppier” or “more accurate, but only because users slowed down.”
Key Results
We measured subjective workload using the NASA Task Load Index (NASA-TLX) questionnaire, a standardized 6-item survey where participants rate their perceived workload on 0–100 scales across six dimensions (Mental Demand, Physical Demand, Temporal Demand, Performance, Effort, Frustration). We report the unweighted average (0–100). It’s widely used in HCI because it captures perceived effort and frustration that can increase even when average performance looks similar.
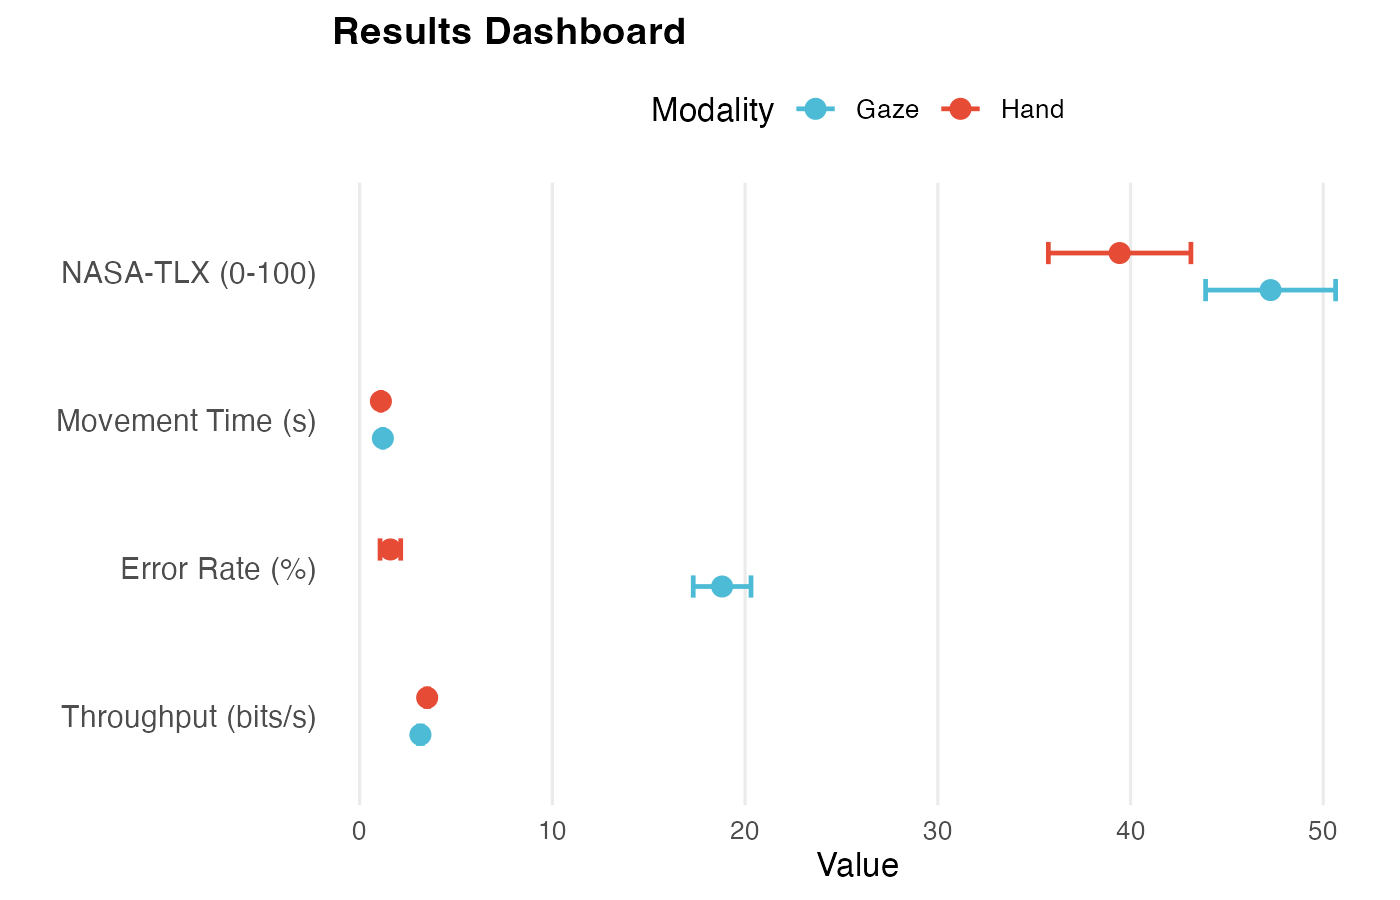
Three Takeaways:
- Hand input outperformed gaze: Higher Throughput (TP; speed–accuracy efficiency) (5.15 vs 4.70 bits/s), lower error rate (1.7% vs 18.6%), lower NASA-TLX (workload) (40.4 vs 47.0)
- Gaze errors are predominantly slips (accidental activations / Midas Touch) (99.2%), not timeouts—validating the Midas Touch problem in XR gaze interaction
- Adaptive UI (declutter: removes non-essential visual elements) showed modest benefits in gaze: slightly lower error rate (18.2% vs 19.1%)
| Results at a Glance | ||||
|---|---|---|---|---|
| Mean [95% CI] by Modality1 | ||||
| Metric |
Hand Modality
|
Gaze Modality
|
||
| Hand | N | Gaze | N | |
| Error Rate (%) | 1.75 [1.23, 2.26] | 297 | 18.65 [17.26, 20.04] | 314 |
| Throughput (bits/s) | 5.15 [5.06, 5.25] | 297 | 4.70 [4.56, 4.83] | 313 |
| Movement Time (s) | 1.09 [1.07, 1.11] | 297 | 1.19 [1.16, 1.23] | 314 |
| NASA-TLX (0-100) | 40.40 [37.03, 43.76] | 81 | 47.03 [43.87, 50.18] | 81 |
| 1 Error rate, throughput, movement time, and NASA-TLX workload scores. We measured subjective workload using the NASA Task Load Index (NASA-TLX) questionnaire, a standardized 6-item survey (0–100 scales). We report unweighted average scores. It's widely used in HCI because it captures perceived effort and frustration that can increase even when average performance looks similar. | ||||
Failure Modes (XR-specific)
What this section shows: XR-specific failure patterns—ways that gaze and hand interactions fail differently, with gaze showing the classic “Midas Touch” problem (accidental activations).
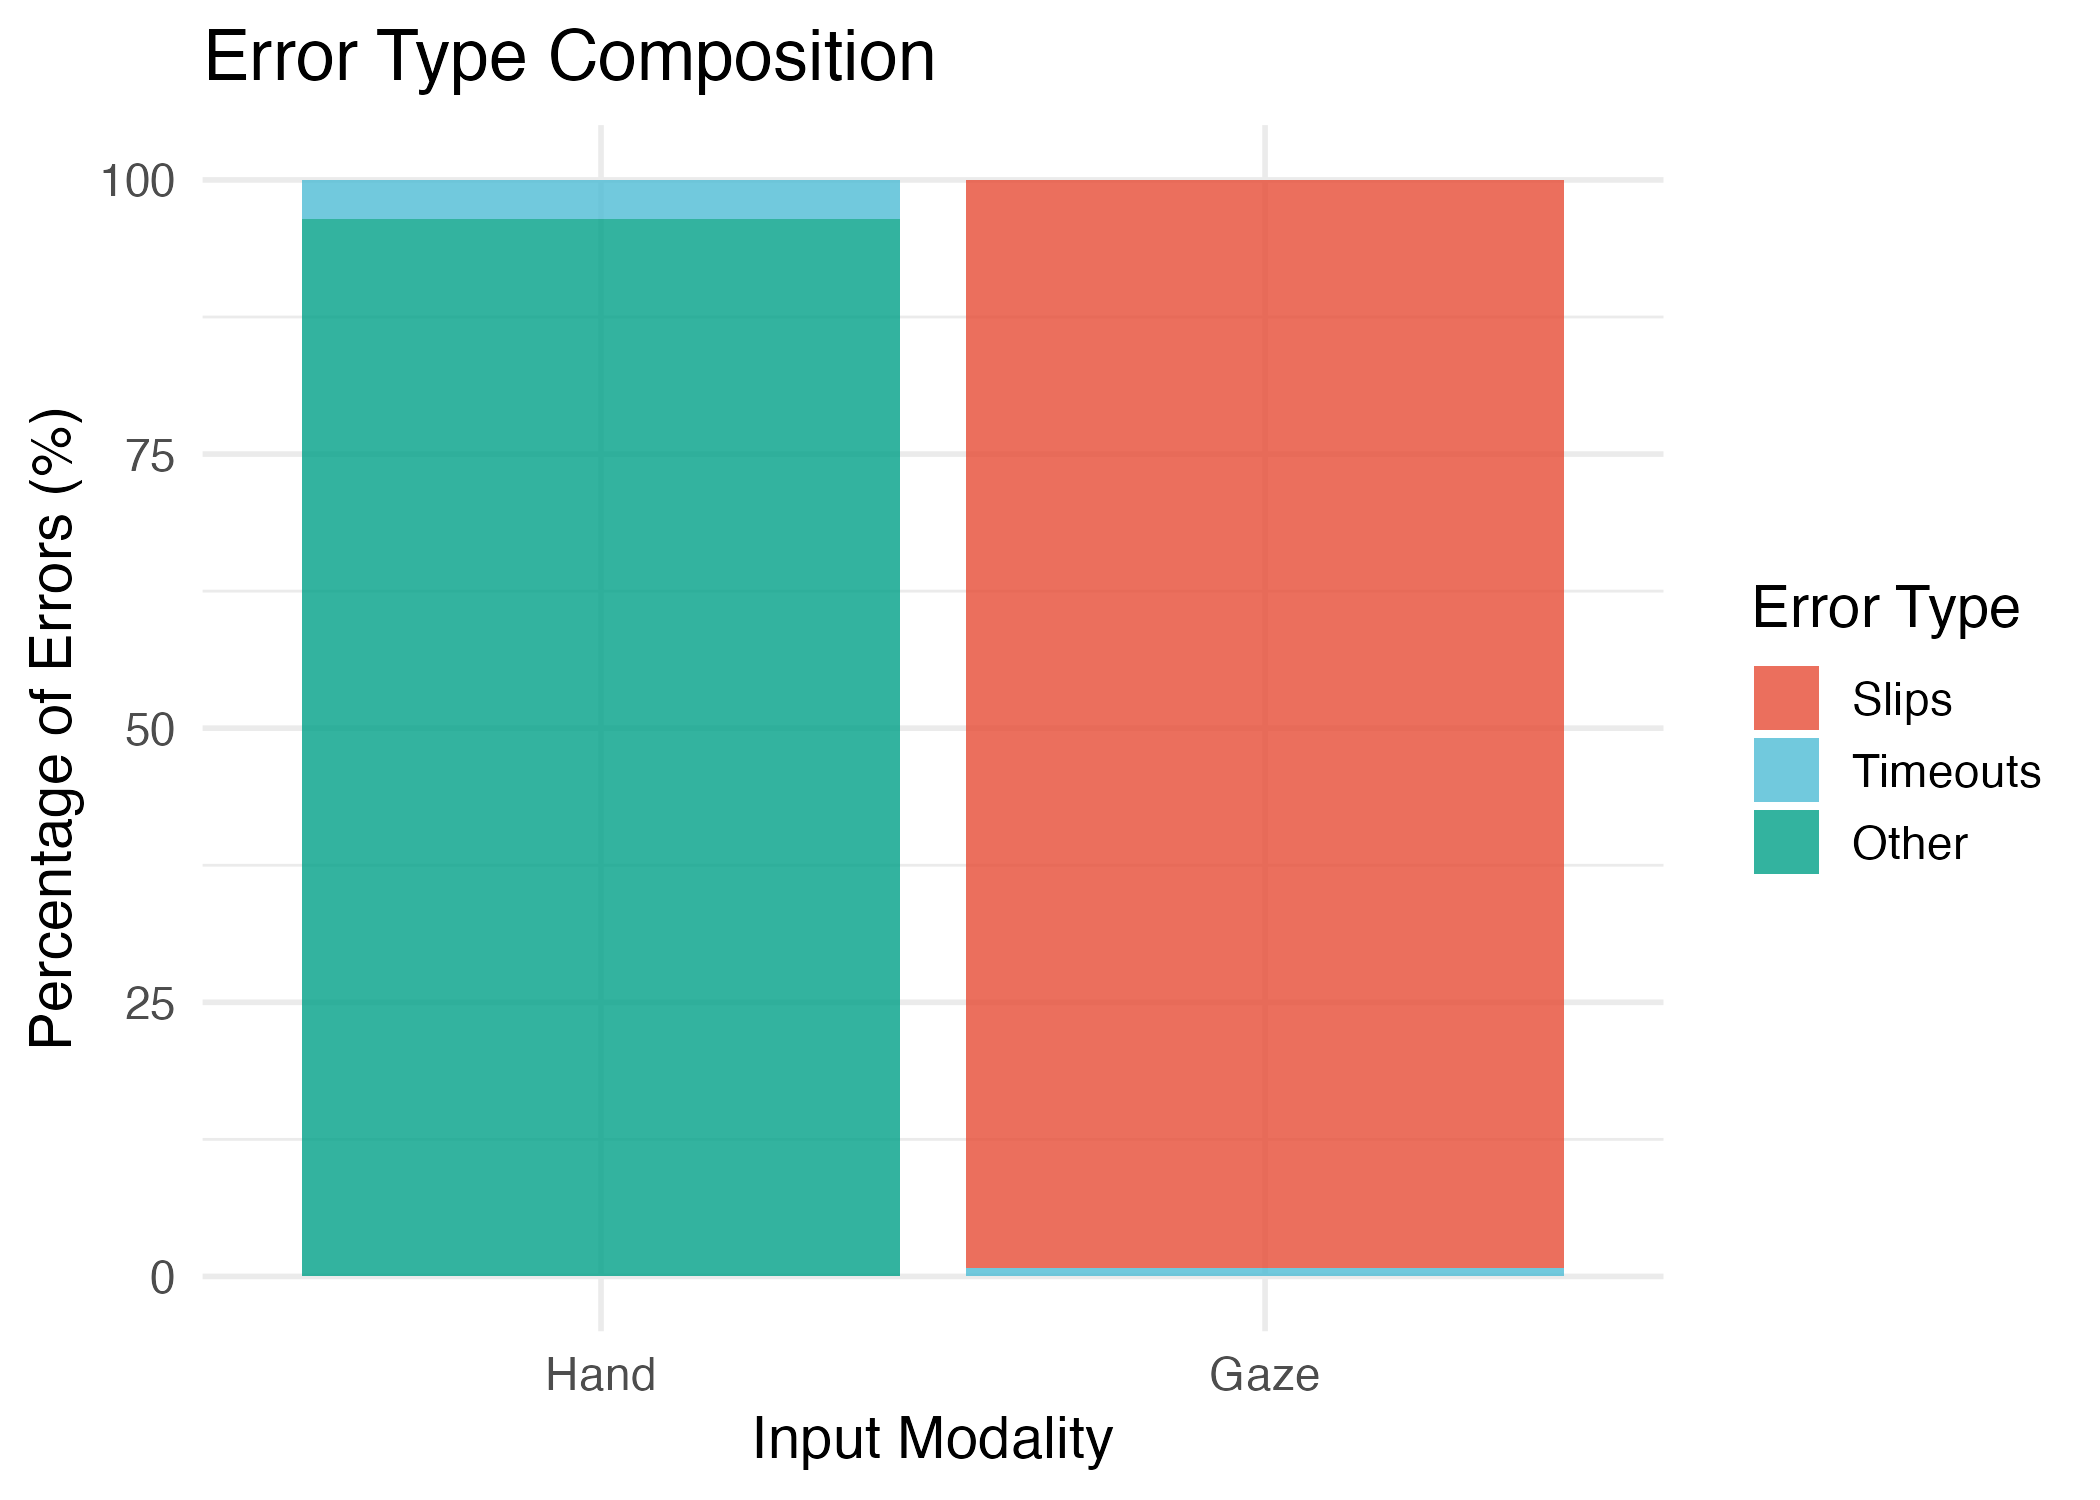
Error Type Breakdown
Gaze errors: 99.2% slips (accidental activations), 0.8% timeouts
Hand errors: 95.7% misses, 4.3% timeouts
This validates a core UX failure mode: gaze interaction suffers from intent ambiguity (looking to see vs. looking to select). The Midas Touch problem is real and measurable.
| Error Type Breakdown | ||||
|---|---|---|---|---|
| Distribution of error types by modality | ||||
| Error Type |
Hand Modality
|
Gaze Modality
|
||
| N | % | N | % | |
| Miss | 110 | 95.7% | 0 | 0.0% |
| Timeout | 5 | 4.3% | 12 | 0.8% |
| Slip | 0 | 0.0% | 1455 | 99.2% |
Spatial Error Patterns
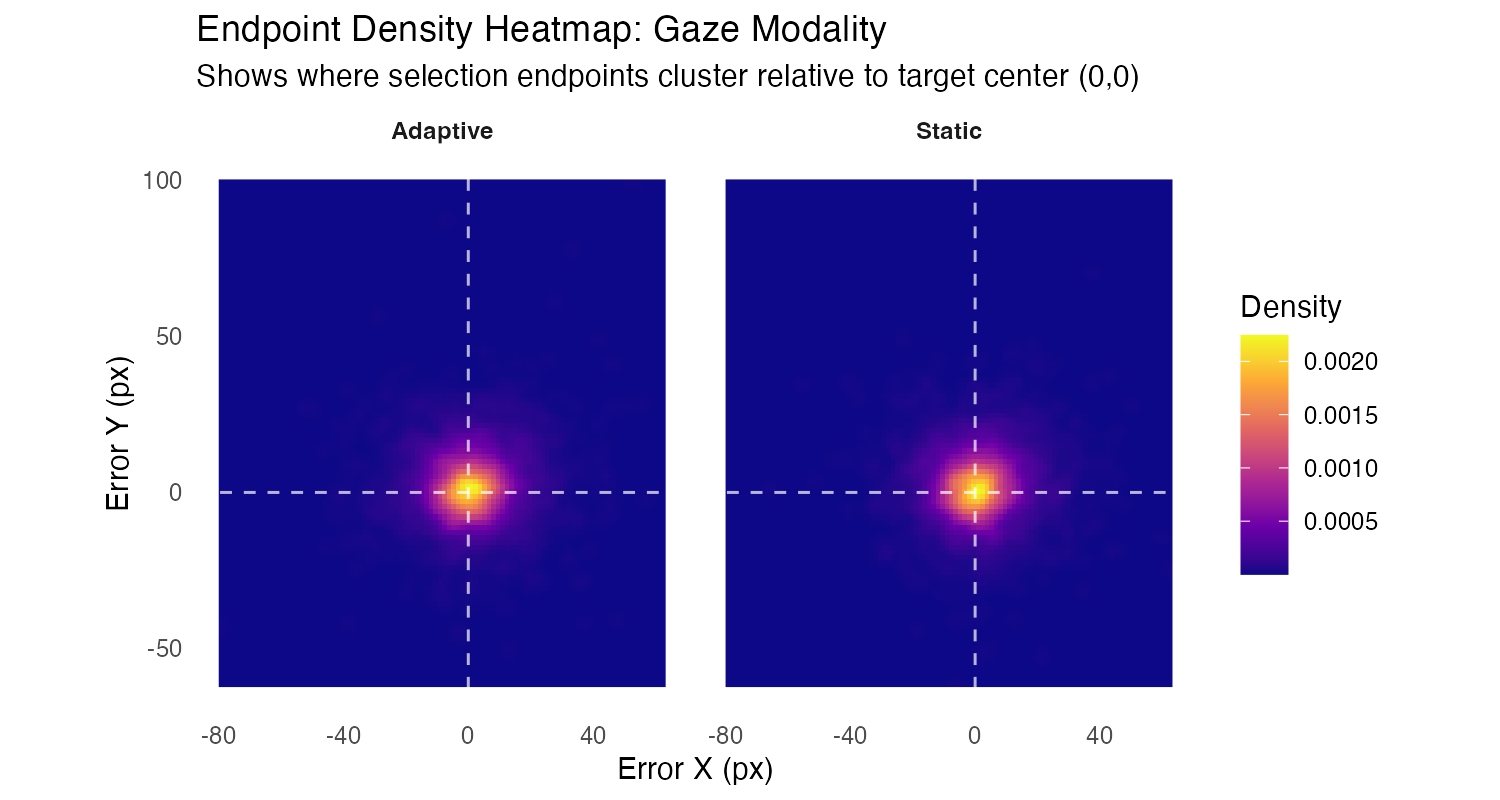
What to look for: Density clusters show where selection endpoints actually land relative to target center (0,0). The white dashed lines mark the target center. Bright yellow/orange indicates high density (many endpoints), dark purple indicates low density. Compare Adaptive vs Static to see if declutter affects endpoint clustering patterns.
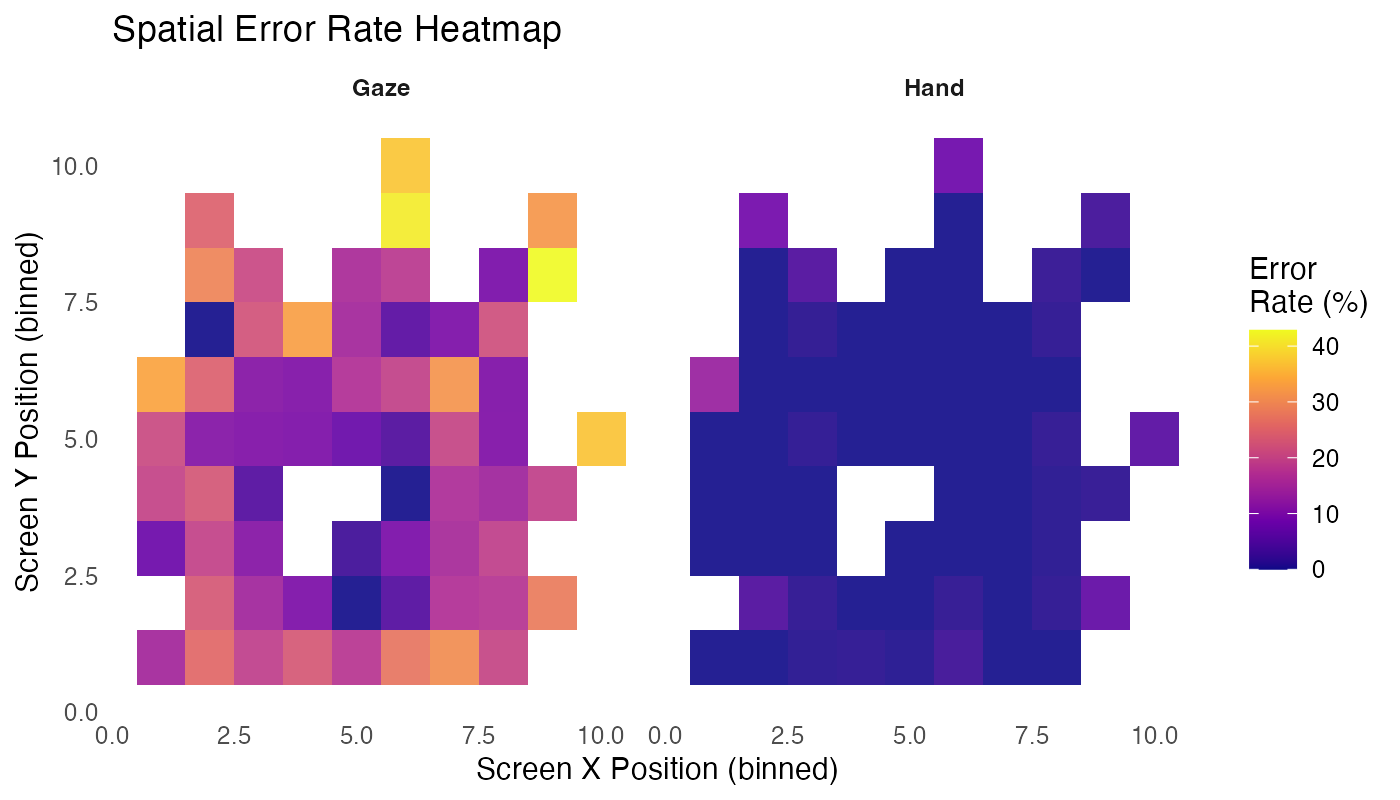
What to look for: Warmer colors indicate higher error rates. Compare Hand vs Gaze to see if certain screen regions show consistently higher errors—this could indicate UI layout issues or visual attention patterns.
Metric cheat sheet (optional)
Fitts’ Law difficulty (standard form):
\mathrm{ID} = \log_2\left(\frac{A}{W} + 1\right)
Units: bits
Variables: A = target distance (px), W = target width (px)
Effective width (ISO 9241-9):
W_e = 4.133 \times \mathrm{SD}(\mathrm{endpoint\ error})
Units: px
Note: Endpoint error is measured along the task axis (projected error)
Effective difficulty:
\mathrm{ID}_e = \log_2\left(\frac{A}{W_e} + 1\right)
Units: bits
Note: Uses effective width instead of nominal width to account for actual user accuracy
Throughput (TP):
\mathrm{TP} = \frac{\mathrm{ID}_e}{\mathrm{MT}}
Units: bits/s
Variables: MT = movement time (s)
Interpretation: Higher TP = better speed–accuracy efficiency
Task: Fitts’ law pointing with varying target distances (A) and widths (W).
Design: 2×2×2 within-subjects factorial (modality × UI mode × pressure)
Conditions: - Modality: Hand (mouse) vs. Gaze (simulated) - UI Mode: Static vs. Adaptive (declutter for gaze: removes non-essential visual elements; width inflation for hand: increases target width, but not activated in this dataset) - Pressure: Low (0) vs. High (1) cognitive load
Participants: N = 81 hand (mouse users), N = 81 gaze (mouse + trackpad users). Trackpad users excluded from hand modality due to device confound.
Trials: ~200 per participant, balanced across conditions using Williams sequencesi.
Metrics: Throughput (bits/s), Movement Time (s), Error Rate (%), NASA-TLXi questionnaire scores (6 subscales, 0–100 each)
Analysis: Linear mixed-effects modelsi (LMM) for continuous outcomes, generalized LMMi (GLMM) for error rates, with random intercepts per participant. Type III ANOVAi with sum-to-zero contrasts.
Adaptive System: What Was Evaluable vs Not
Gaze adaptive UI (declutter) was evaluated: PolicyEngine activated declutter based on performance triggers (RT p75 thresholds, error bursts). Results show modest error reduction (18.2% vs 19.1%) but no significant throughput benefit.
Hand adaptive UI (width inflation) did not activate: PolicyEngine emitted 243 inflate_width actions (17 participants), but width_scale_factor i remained 1.0 throughout. Root cause: UI integration issue—policy actions were emitted but not applied to rendered targets. See Appendix for full diagnostic analysis.
Implications for XR Product Teams
For Gaze Interaction: Slip prevention is the higher-leverage fix (in this dataset)
The dominant gaze failure mode is slips (99.2%), not simple misses. Decluttering UI helps, but the bigger opportunity is intent disambiguation—confirmation mechanisms, stabilization, snapping, dwell tuning, and clear state feedback. Prioritize reducing the verification burden rather than just reducing visual chrome.
For Hand Interaction: Instrumentation Caught Non-Activation
Hand width inflation did not activate in this dataset; instrumentation and validated logging caught this early. The feature was instrumented but not exercised, so its benefit is unconfirmed.
For Adaptation Policy: Thresholds need calibration + validation
The concept is sound, but adaptation effects were small because triggers and mechanisms need tuning. Not all “adaptive” changes are meaningful—decluttering UI can be helpful, but targeting the dominant failure mode (slips) is more impactful. Policy thresholds must be calibrated through iterative testing, not assumed.
Limitations & Lessons
Limitations
- Hand adaptive UI not exercised: Width inflation did not activate (width_scale_factor always 1.0), so hand UI-mode effects cannot be interpreted as adaptation effectiveness. Root cause: PolicyEngine emitted actions but UI integration did not apply them.
- Unbalanced design: Hand N=75 (mouse only), Gaze N=81 (mouse + trackpad). Type III ANOVA handles this appropriately.
- Gaze simulation: Gaze input uses physiologically-informed simulation, not eye tracking hardware.
Lessons Learned
- Device standardization matters: Trackpad vs. mouse differences required exclusion of trackpad users from hand modality.
- Policy integration critical: PolicyEngine logic executed correctly, but UI integration failed to apply width scaling actions.
- Gaze errors are slips, not timeouts: 99.2% of gaze errors are slips (accidental activations), validating the Midas Touch problem. This suggests intent disambiguation (confirmation, stabilization) is more important than reducing UI chrome.
- Adaptive UI benefits modest: Declutter showed small error reduction in gaze, but throughput effects were minimal. Targeting the dominant failure mode (slips) may be more impactful than general UI simplification.
Appendix
Technical Details & Statistical Analysis
Omnibus Models (2×2×2)
Model Specifications:
- Throughput:
TP ~ modality × ui_mode × pressure + (1 | pid)
- Error Rate:
error ~ modality × ui_mode × pressure + (1 | pid)(binomial GLMM)
- Movement Time:
log(RT) ~ modality × ui_mode × pressure + (1 | pid)
- NASA-TLX:
TLX ~ modality × ui_mode × pressure + (1 | pid)
All models use Type III ANOVA with sum-to-zero contrasts. Random intercepts per participant.
Key Interpretation Rule: UI-mode effects reflect declutter in gaze; width inflation not exercised in hand, so any hand UI-mode effects are treated as noise/non-causal.
Gaze-Only Follow-up
Gaze-only models (ui_mode × pressure, random intercept pid):
- Throughput:
TP ~ ui_mode × pressure + (1 | pid)
- Error Rate:
error ~ ui_mode × pressure + (1 | pid)
- Movement Time:
log(RT) ~ ui_mode × pressure + (1 | pid)
- NASA-TLX:
TLX ~ ui_mode × pressure + (1 | pid)
Estimated Marginal Means (EMMs) with Holm-adjusted pairwise contrasts for ui_mode within each pressure level.
Hand: UI-Mode Not Exercised
Manipulation Check:
| Hand Width Inflation: Manipulation Check | |
|---|---|
| Diagnostic metrics showing width_scale_factor == 1.0 throughout (no activation) | |
| Metric | Value |
| Total trials (all conditions) | 17,359 |
| Total participants | 81 |
| Trials with width scaling (all conditions) | 0 |
| Percentage scaled (all conditions) | 0.0% |
| Hand/Adaptive/Pressure=1 trials | 2,214 |
| Trials with width scaling (Hand/Adaptive/P1) | 0 |
| Percentage scaled (Hand/Adaptive/P1) | 0.0% |
| Participants with ≥1 policy trigger | 81 |
| Participants with ≥5 consecutive triggers1 | 1 3 |
| Percentage with ≥5 consecutive triggers | 3.7% |
| Median max consecutive triggers (per participant) | 2 |
| Mean max consecutive triggers (per participant) | 2.5 |
| Maximum consecutive triggers (any participant) | 5 |
| Pressure logging mismatch rate2 | 2 N/A |
| 1 Number of trials in a row where policy conditions were met (needed ≥5 for hysteresis to activate width scaling) | |
| 2 Percentage of Hand/Adaptive trials where logged pressure value doesn't match runtime pressure state (indicates a data logging bug) | |
Policy Replay Diagnostics
Data-backed conclusion: Width inflation never activated: 0 trials with width_scale_factor != 1.0. PolicyEngine emitted 243 inflate_width actions (17 participants), but UI integration did not apply them. Root cause: UI integration issue—policy actions were emitted but not applied to rendered targets.
Adaptation activation summary:
| Policy Replay Summary | ||||||||
|---|---|---|---|---|---|---|---|---|
| Hand width inflation: activation diagnostics | ||||||||
| Total Participants |
Width Inflation Activation
|
Bad Streak (≥5 consecutive)
|
Policy Events
|
Most Common Trigger Reason
|
||||
| Width Inflation Activated | % Activated | Bad Streak ≥5 | % Bad Streak | Inflation Events | Total Policy Events | Top Reason | Reason Count | |
| 85 | 17 | 20.0% | 64 | 75.3% | 243 | 2,087 | Reset | 41 |
Gaze input uses a physiologically-informed simulation rather than eye tracking hardware. This approach allows controlled comparison of hand vs gaze interaction patterns while maintaining ecological validity for XR selection tasks.
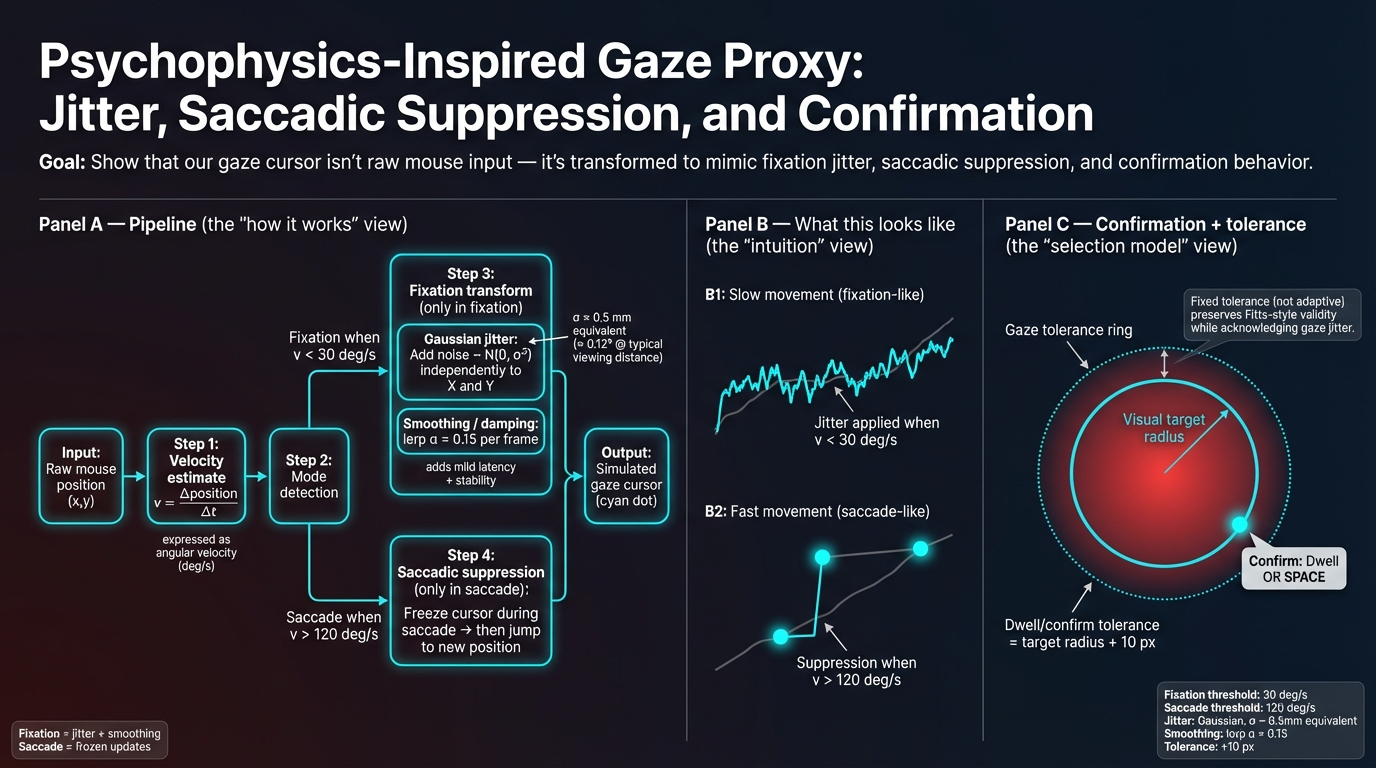
Psychophysics model:
- Gaussian jitter (σ ≈ 1–2° visual angle): Simulates natural eye movement variability. Real eye tracking has inherent noise; Gaussian jitter captures this uncertainty in gaze position estimation.
- Saccadic suppression: Temporary input masking during rapid eye movements (saccades). Prevents false selections during eye movements, mimicking how real eye trackers suppress input during saccades.
- Latency injection (50–150ms delay): Approximates real-world eye tracking system delays. Commercial eye trackers have processing latency; injected delay makes simulation more realistic.
Calibration:
- Pixels-per-degree conversion: Based on screen dimensions and viewing distance assumptions. Converts screen pixels to visual angle degrees, enabling consistent difficulty across different display sizes.
Reliability guards (QC gates):
- Zoom level check: Must be 100% (prevents scaling artifacts that would distort target sizes)
- Fullscreen mode: Required (ensures consistent viewport and eliminates browser chrome interference)
- Tab visibility: Hidden duration <500ms threshold (filters trials where user switched tabs)
- Focus/blur events: Zero tolerance (ensures window had focus throughout trial)
- RT bounds: 150–6000ms (filters non-physiological responses: too fast = accidental clicks, too slow = disengagement)
These guards ensure data quality and prevent confounds from display state or user disengagement.
Before/after counts:
| Quality Control Exclusions | ||
|---|---|---|
| Trials removed by exclusion rule | ||
| Exclusion Rule | Trials Removed | % Removed |
| Practice trials | 1,640 | 8.59% |
| Zoom != 100% | 68 | 0.36% |
| Not fullscreen | 1,819 | 9.53% |
| Tab hidden > 500ms | 0 | 0.00% |
| Focus/blur events | 0 | 0.00% |
| RT < 150ms | 24 | 0.13% |
| RT > 6000ms | 63 | 0.33% |
| Incorrect trials (for performance metrics) | 0 | 0.00% |
| Trackpad users (hand modality only) | 708 | 3.71% |
What LBA adds:
Linear Ballistic Accumulator (LBA) modeling provides latent parameter interpretation: drift rate (information accumulation speed), threshold (decision boundary), and non-decision time (NDT, encoding + motor execution). This decomposes RT into cognitive components, revealing how modality and UI mode affect decision-making processes during the verification phase.
Model specification:
We fit a hierarchical Bayesian LBA model using PyMC, modeling the verification phase (time from first target entry to final selection). The model uses:
- Non-decision time (t0): Varies by modality and UI mode (captures physical actuation differences)
- Drift rate (v): Varies by Index of Difficulty (ID) - harder trials → lower drift rate
- Threshold (b): Varies by pressure condition (speed-accuracy tradeoff)
- Start point variability (A): Per-participant random effect
Data: 16,947 valid trials from 81 participants, filtered to verification phase RTs (200-5000 ms).
Sampling: 8 chains × 1,500 warmup + 1,000 draws per chain (total: 20,000 iterations) on a 64-core VM. Model converged successfully (R-hat < 1.01, ESS > 2,000 for all parameters).
| LBA Parameter Estimates | |||||
|---|---|---|---|---|---|
| Group-level means by modality and UI mode (verification phase)1 | |||||
| Condition | Non-Decision Time (t0) | Base Drift Rate | ID Slope | Threshold Intercept | Pressure Slope |
| Hand - Static | -2.846 | 5.035 | -0.935 | 4.686 | 0.058 |
| Hand - Adaptive | -3.008 | 5.035 | -0.935 | 4.686 | 0.058 |
| Gaze - Static | -1.410 | 5.035 | -0.935 | 4.686 | 0.058 |
| Gaze - Adaptive | -0.971 | 5.035 | -0.935 | 4.686 | 0.058 |
| 1 Parameters are in log-space (softplus transformed). t0: non-decision time; vc_base: base drift rate; vc_slope: effect of ID on drift (negative = harder trials reduce drift); gap_int: threshold intercept; gap_slope: effect of pressure on threshold (positive = higher pressure increases threshold). | |||||
Key findings:
Modality effect on non-decision time: Gaze has higher t0 than Hand (gaze: -1.41 to -0.97, hand: -3.01 to -2.85), indicating longer verification phase duration for gaze interaction—consistent with the need for intent disambiguation.
UI mode effect: Adaptive UI shows different t0 patterns, particularly in gaze (static: -1.41, adaptive: -0.97), suggesting adaptive declutter may affect verification timing.
Difficulty effect: Negative ID slope (-0.935) confirms harder trials reduce drift rate, as expected from Fitts’ Law.
Pressure effect: Positive pressure slope (0.058) indicates speed-accuracy tradeoff—higher pressure increases decision threshold.
Convergence diagnostics:
| LBA Model Convergence Diagnostics | |||||
|---|---|---|---|---|---|
| R-hat < 1.01 indicates excellent convergence; ESS > 400 indicates sufficient effective sample size | |||||
| Parameter | Mean | 95% CI Lower | 95% CI Upper | R-hat | ESS Bulk |
| vc_slope_mu | -0.935 | -0.954 | -0.915 | 1.000 | 14005 |
| gap_slope_mu | 0.058 | 0.031 | 0.085 | 1.000 | 19185 |
| ve_mu | -0.019 | -3.721 | 3.707 | 1.000 | 20289 |
| vc_base_mu | 5.035 | 4.875 | 5.200 | 1.000 | 2629 |
| gap_int_mu | 4.686 | 4.464 | 4.882 | 1.000 | 2086 |
Trace plots:
Trace plots: Convergence was verified (R-hat < 1.01,
ESS > 2,000 for all parameters — see table above). Trace plot image
will be added in the final manuscript version.
Interpretation:
The LBA model successfully decomposed verification phase RTs into cognitive components. The modality differences in non-decision time align with the observed performance differences: gaze requires longer verification time due to intent ambiguity (Midas Touch problem), while hand input benefits from clearer motor intent. The adaptive UI effects on t0 suggest that decluttering may reduce verification burden, though the effects are modest.
Note: A detailed paper on the LBA analysis methodology, parameter interpretation, and theoretical implications is available as a preprint: Dastgheib, M., & Pourmahdian, F. (2026). The Midas Touch in Gaze vs. Hand Pointing: Modality-Specific Failure Modes and Implications for XR Interfaces. arXiv:2603.15991 [cs.HC]. https://doi.org/10.48550/arXiv.2603.15991